
Folium is a Python library that allows you to create interactive maps in HTML. It is based on Leaflet, an open source JavaScript library, and relies on the features of the Python language to make data manipulation and the creation of complex visualizations easier. In use, Folium proves to be a library that is easy to learn and use. In addition, it offers a wide range of features for creating geographic data visualizations.
The 2022 French legislative elections provide an opportunity to illustrate its possibilities: let’s see how to interpret the results.
Choropleths are maps that use color to represent a quantitative variable. They are a powerful tool for visualizing the distribution of a characteristic within a territory. Here, they are used to visualize the distribution of votes in the legislatives. The goal is to analyze the homogeneity of the constituencies, to highlight the concentrations and cleavages within them.
Folium offers a wide range of features to customize choropleth maps. Among these are:
- Defining thresholds for the colors of the map.
- Adding labels to the regions of the map.
- The ability to add legends to the map.
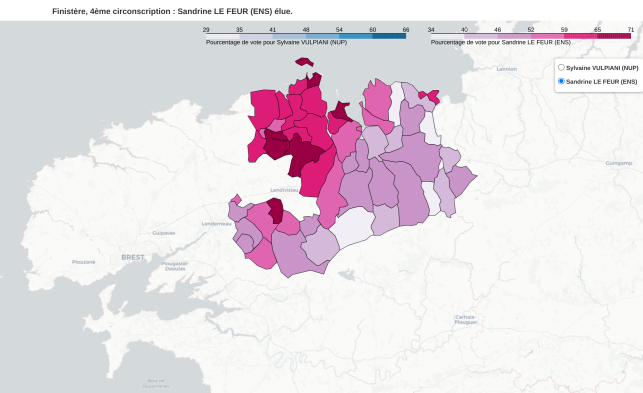
The map below gives an overview of the result for the 4th constituency of Finistère.
The result of using folium is a small Python project that allows you to consult the results of the 2022 legislative elections, constituency by constituency.
The realization is detailed on the page of the small project and the source code is available on a Github repository.